Retention and graduation
The tables below show the overall retention plus graduation rates for the College of Business and Management programs. The first table shows the sum of retention and graduation rates, as it makes sense to club the two numbers given the amount of time our students (not only are they non-traditional, but most of them work multiple jobs) take to graduate.
The retention plus graduation rates look very promising, with an average of more than 90%, including all undergraduate majors since 2016. The numbers have been fairly consistent across all the undergraduate majors. In 2021, the graduation plus retention rate reported is more than what it was in 2016 for most undergraduate majors.
Sum (retention plus graduation)
| 2016 | 2017 | 2018 | 2019 | 2020 | 2021 | |
|---|---|---|---|---|---|---|
| Accounting | 95.3 | 87.1 | 88.1 | 89.9 | 91.5 | 87.9 |
| Business Administration | 85.2 | 90.6 | 91 | 92 | 91.2 | 92.6 |
| Decision Science | 87.5 | 96.4 | 95.3 | 85.7 | 96 | 94.3 |
| Economics | 73.5 | 92.3 | 93.3 | 88.9 | 87.5 | 87.5 |
| Finance | 91.6 | 92.2 | 81.4 | 88 | 92.9 | 93.7 |
| Human Resource Management | 83.8 | 96.8 | 92.8 | 91.9 | 91.6 | 96.7 |
| International Business | 95.5 | 100 | 92.9 | 100 | 95.4 | 87.5 |
| Management | 83 | 91.2 | 94 | 93.7 | 94.9 | 90.2 |
| Management Information Systems | 87.1 | 94.6 | 92.7 | 84.8 | 95.9 | 92.1 |
| Marketing | 90.3 | 98.5 | 90.5 | 93.6 | 86.7 | 92.5 |
The retention plus graduation rates show a healthy upward trend for our three graduate programs, MBA, MS in MIS, and the Doctoral program, at 93.3%, 94.2%, and 87.5%, respectively.
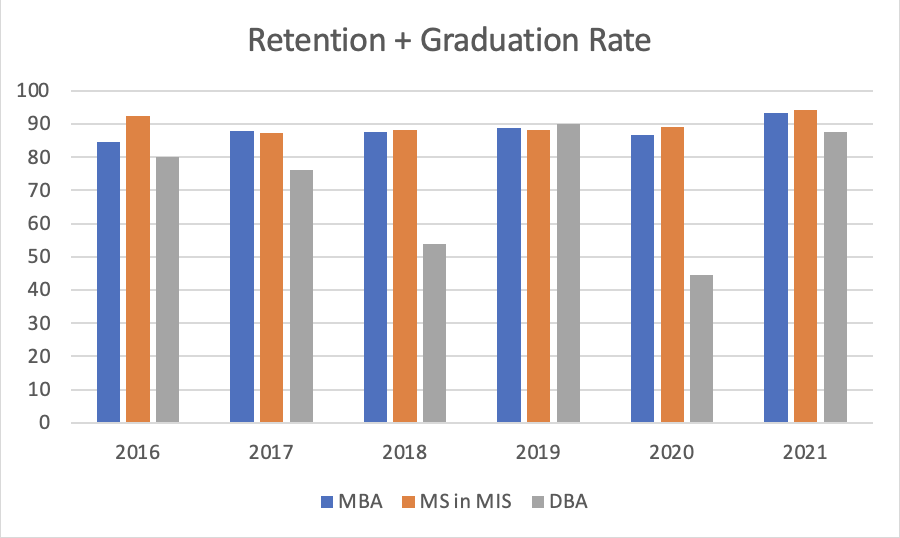
| 2016 | 2017 | 2018 | 2019 | 2020 | 2021 | |
|---|---|---|---|---|---|---|
| MBA | 92.4 | 88 | 87.6 | 88.8 | 86.8 | 93.3 |
| MS in MIS | 88.8 | 87.2 | 88.1 | 88.1 | 89 | 94.2 |
| DBA | 80 | 76.1 | 53.9 | 90 | 44.4 | 87.5 |
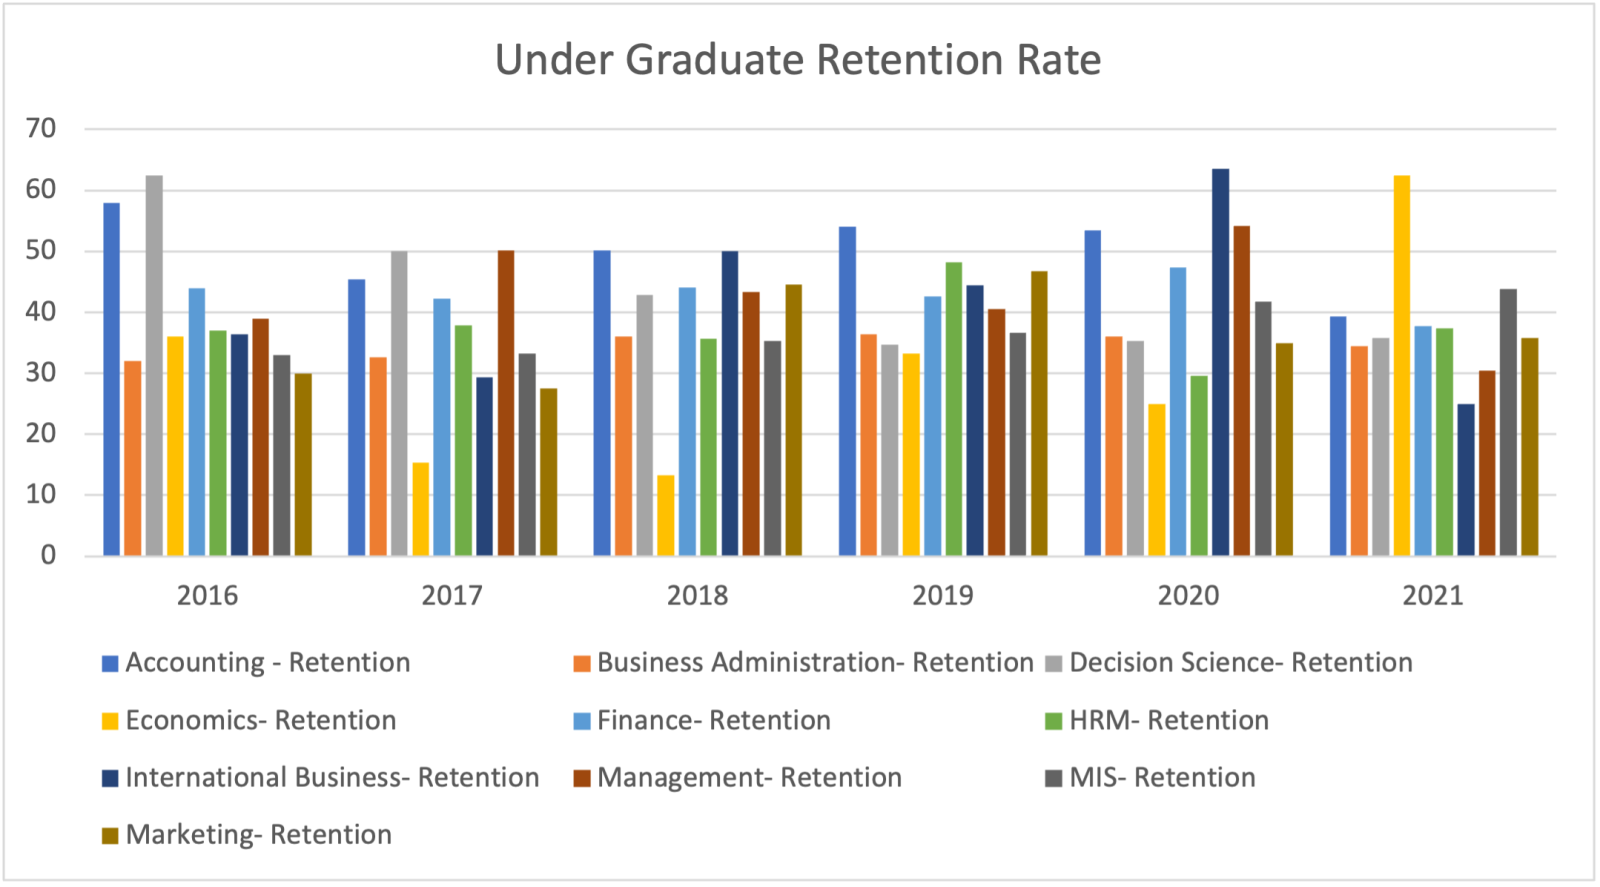
The table on undergraduate-level retention shows that after the pandemic hit, the retention rate for students has been impacted, which is in alignment with the overall declining retention rates of students since the pandemic. The trend otherwise has been either promising or consistent since 2013.
Retention rate
| 2013 | 2014 | 2015 | 2016 | 2017 | 2018 | 2019 | 2020 | 2021 | |
|---|---|---|---|---|---|---|---|---|---|
| Accounting | 51 | 53 | 51 | 58 | 45.4 | 50.1 | 54.1 | 53.5 | 39.3 |
| Business Administration | 29 | 34 | 33 | 32 | 32.6 | 36 | 36.4 | 36.1 | 34.5 |
| Decision Science | N/A | N/A | N/A | 62.5 | 50 | 42.9 | 34.7 | 35.3 | 35.8 |
| Economics | 23 | 20 | 13 | 36 | 15.4 | 13.3 | 33.3 | 25 | 62.5 |
| Finance | 48 | 52 | 47 | 44 | 42.2 | 44.1 | 42.6 | 47.4 | 37.8 |
| Human Resource Management | 41 | 53 | 36 | 37 | 37.9 | 35.7 | 48.2 | 29.6 | 37.4 |
| International Business | 67 | 79 | 23 | 36.4 | 29.4 | 50 | 44.4 | 63.6 | 25 |
| Manangement | 40 | 44 | 43 | 39 | 50.1 | 43.3 | 40.6 | 54.2 | 30.5 |
| Management Information Systems | 59 | 31 | 50 | 33 | 33.3 | 35.3 | 36.7 | 41.7 | 43.8 |
| Marketing | 34 | 38 | 36 | 30 | 27.5 | 44.6 | 46.8 | 34.9 | 35.8 |
Of the ten undergraduate majors being offered, six majors have either more than or close to 50% student retention, which is remarkable given that Metro State is a non-traditional university serving first-generation, immigrant, and minority students that often have family and work responsibilities beyond school. The majority of our students are part-time students. The retention rates for Accounting, Finance, International Business, and Management have been consistent over the years and are above or close to 40% from 2013 to 2020. Also, it should be noted that Management is one of the more sought-after majors. The retention rate for Management was the highest in the year 2020 and was substantially down during the global pandemic. Please note that the data for Decision Sciences are not available for the years 2013 to 2015. In summary, given the strategic focus of Metro State University to serve diverse students from underserved groups, retention of our students has been one of the strategic priorities, and there are various efforts in place to increase students’ retention in the years to come. Some of the efforts are mentioned below:
- Call Campaigns: Students who attended the previous semester but have not registered for the upcoming semester are contacted. Callers assist non-registered students by answering questions, discussing registration options, and providing resources to encourage students to return.
- Early Alert System: The Early Alert System allows faculty to alert academic advisors about students who are struggling in class. Advisors contact students and offer assistance with the problems they are experiencing.
- Admits on Probation Process: Any student who does not meet the minimum admissions criteria can be admitted on probation. Students receive customized communications and a special onboarding session at the beginning of the semester.
- Academic Success Workshops: Students on probation must complete this online workshop before meeting with their academic advisor for the first time. The workshop is designed to help students understand the significance of academic standing and guide them in creating an Academic Success Plan.
- No Show Report: This report indicates that students had not logged into their D2L course sites at all during the first week. Instructors and advisors can reach out to them and offer assistance, encouraging them to resume classes.
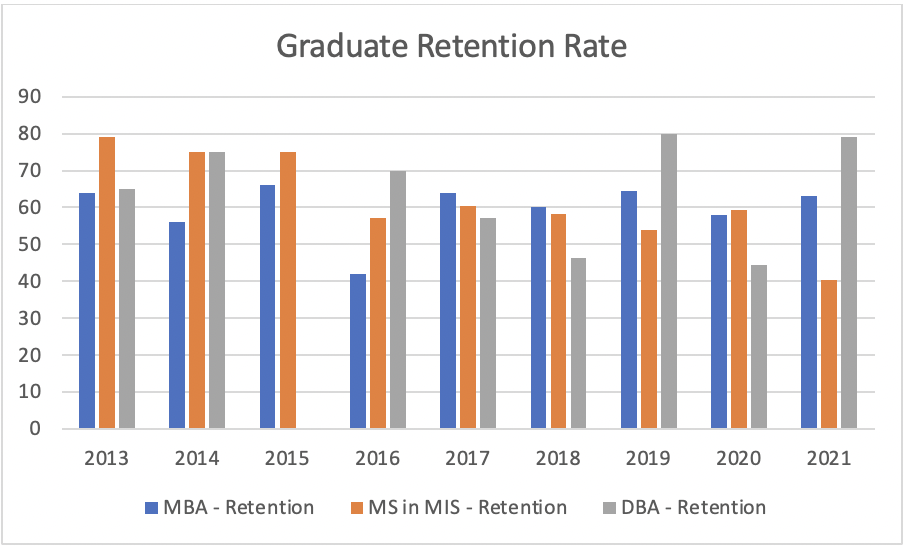
The graduate-level retention paints an optimistic picture. The retention rate for all three programs, Masters in Business Administration (MBA), Master of Science in Management Information Systems (MS in MIS), and the Doctoral Program in Business Administration (DBA) has been more than 50% for the most part since 2013. We don’t have data for the year 2015 for our DBA program. Notably, our MBA students’ retention rates have remained pretty consistent at 60% over the years. At the same time, it is promising to note that the retention rates stayed consistent during the pandemic. This could be attributed to the fact that our program was quick enough to respond to the market's changing demands in moving all our classes to either online or HyFlex modality when hit by the pandemic. Additionally, our affordable low tuition for our high-quality programs acted as a motivator for many of our students.
Graduate retention rate
| 2013 | 2014 | 2015 | 2016 | 2017 | 2018 | 2019 | 2020 | 2021 | |
|---|---|---|---|---|---|---|---|---|---|
| MBA | 64 | 56 | 66 | 42 | 64 | 60.1 | 64.5 | 57.9 | 63.2 |
| MS in MIS | 79 | 75 | 75 | 57 | 60.3 | 58.2 | 53.9 | 59.3 | 40.4 |
| DBA | 65 | 75 | N/A | 70 | 57.1 | 46.2 | 80 | 44.4 | 79.2 |
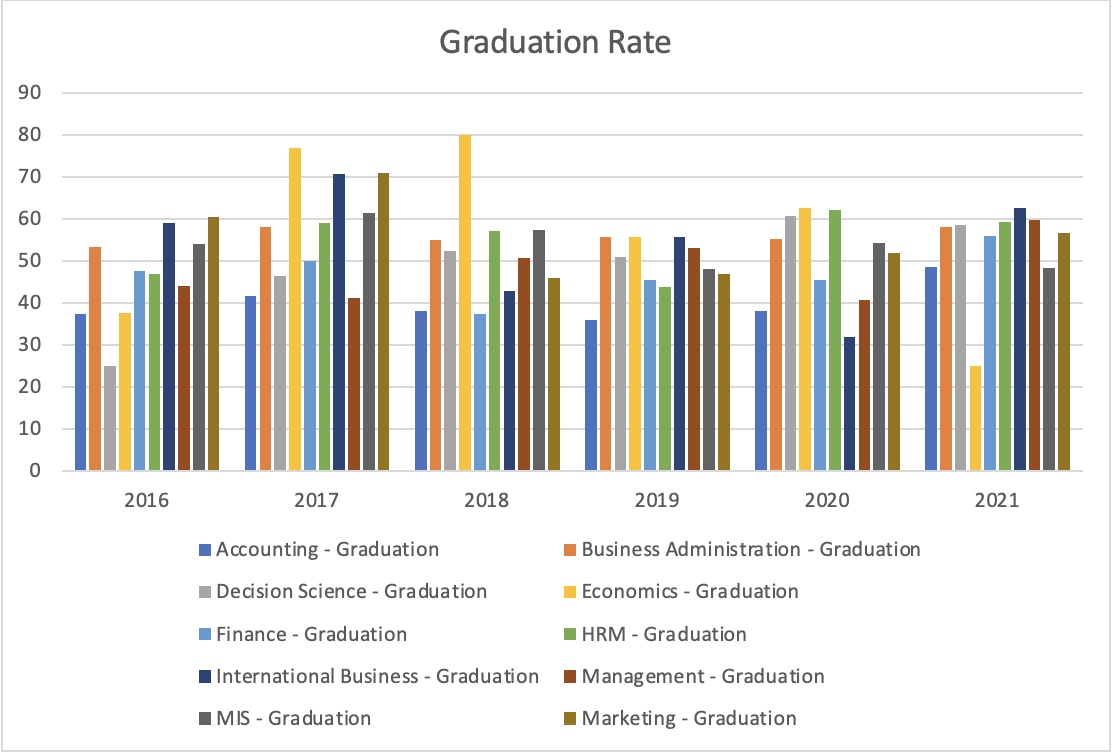
As shown in the table below, the graduation rate was moderately strong during the pandemic. The numbers for 2020 and 2021 looked promising for all majors, with the graduation rate either touching or crossing the 50% mark. This anomaly between the retention and graduation rates can be explained by the fact that many students started working remotely during the pandemic and the fact that Metro State’s College of Business and Management quickly converted to online classes, which might have provided students the opportunity to finish their education.
Graduation rate
| 2016 | 2017 | 2018 | 2019 | 2020 | 2021 | |
|---|---|---|---|---|---|---|
| Accounting | 37.3 | 41.7 | 38 | 35.8 | 38 | 48.6 |
| Business Administration | 53.2 | 58 | 55 | 55.6 | 55.1 | 58.1 |
| Decision Science | 25 | 46.4 | 52.4 | 51 | 60.7 | 58.5 |
| Economics | 37.5 | 76.9 | 80 | 55.6 | 62.5 | 25 |
| Finance | 47.6 | 50 | 37.3 | 45.4 | 45.5 | 55.9 |
| International Business | 59.1 | 70.6 | 42.9 | 55.6 | 31.8 | 62.5 |
| Human Resource Management | 46.8 | 58.9 | 57.1 | 43.7 | 62 | 59.3 |
| Management | 44 | 41.1 | 50.7 | 53.1 | 40.7 | 59.7 |
| Management Information Systems | 54.1 | 61.3 | 57.4 | 48.1 | 54.2 | 48.3 |
| Marketing | 60.3 | 71 | 45.9 | 46.8 | 51.8 | 56.7 |
It is encouraging to note that the graduation rates for all ten undergraduate majors have either substantially increased or remained stable since 2013. Majors including Business Administration, Decision Sciences, Finance, Human Resource Management, International Business Management, Management Information Systems, and Marketing all showed solid numbers over the years.
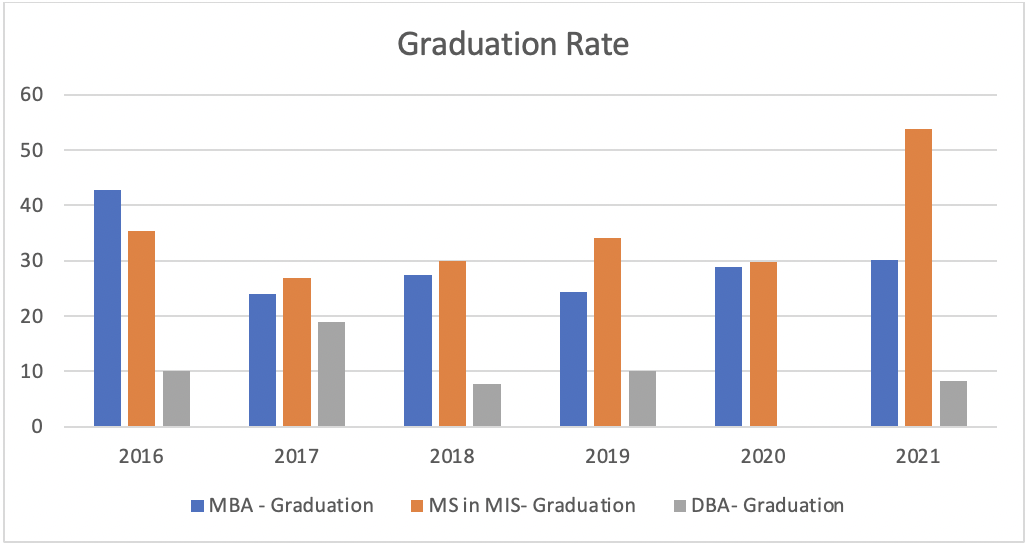
It is interesting to note that the graduation rate for our master's programs varied across disciplines. While the numbers have remained stable for MBA with a 20 to 30% graduation rate, MIS has witnessed a sharp increase in graduation rate in the year 2021. This could be attributed to increased demand for information technology area in recent years, providing additional support to our students in helping them graduate. Given that our doctoral cohorts run once every two years, with a cohort size that varies between 10 to 15 candidates, the graduation rate is not as high as the other two graduate programs which admit students every semester.
Graduate graduation rate
| 2016 | 2017 | 2018 | 2019 | 2020 | 2021 | |
|---|---|---|---|---|---|---|
| MBA | 42.7 | 24 | 27.5 | 24.3 | 28.9 | 30.1 |
| MS in MIS | 35.4 | 26.9 | 29.9 | 34.2 | 29.7 | 53.8 |
| DBA | 10 | 19 | 7.7 | 10 | 0 | 8.3 |